
by Morgan Flood, Policy Research Specialist
In this month’s Policy Blog, Central Pennsylvania Food Bank’s Impact & Policy Research uses data from the 2022 Census of Agriculture to shine a light on the growers who help put local, nutritious food on the tables of Pennsylvanians across the Commonwealth. Every five years, the United States Department of Agriculture (USDA) conducts a Census of Agriculture, which counts every farm operation that produced at least $1,000 of agricultural products in that year. The Census collects information about land use, crop production, producers, and much more.
USDA defines a producer as “a person who is involved in making decisions for the farm operation. Decisions may include decisions about such things as planting, harvesting, livestock management, and marketing. The producer may be the owner, a member of the owner’s household, a hired manager, a tenant, or a renter. […] The census collected information on the total number of male producers, the total number of female producers, and demographic information for up to four producers per farm.” Pennsylvania’s farm producers are diverse, just like the Commonwealth and the crops they grow within it; the rest of this post highlights the geographic and demographic diversity found within Pennsylvania agricultural production.
The Central Pennsylvania Food Bank is proud to collaborate with producers across our service territory through a variety of programs, including the state-funded Pennsylvania Agricultural Surplus System (PASS), federally funded Local Food Purchase Assistance (LFPA), and CPFB’s own Bid Buy Donate. All three of these programs provide important support to farmers as they sustainably share nutritious local food with our neighbors in need.
Statewide
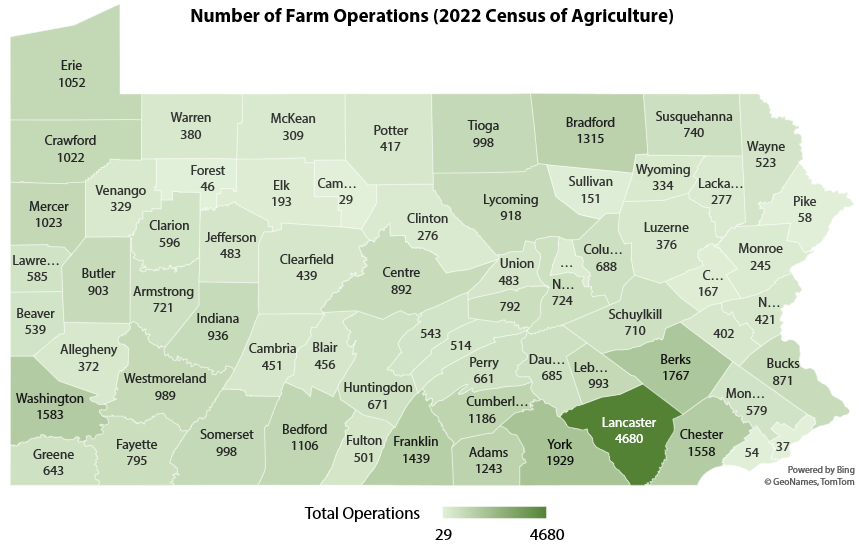
As of 2022, there are 49,053 farm operations in the Commonwealth of Pennsylvania operated by 90,032 producers. The map above shows the number of operations in each county. Nearly 10% of Pennsylvania’s farms are in Lancaster County alone, at more than 4,600 farms; this can be explained in part by the county’s sizable Plain community. No other county has more than 2,000 operations, though York is close at 1,929 (3.9% of total).
The following tables show the number of both operations and producers by specific demographic characteristic, along with the proportion of the statewide total for which each group accounts.
Please note that the figures for operations in all cases, and the percentages for the race/ethnicity tables, do not total to the statewide overall figure or to 100% respectively. Operations with multiple producers may have producers falling into different demographic categories and, because the Census of Agriculture race/ethnicity tables do not break racial categories into Hispanic and non-Hispanic, individuals identifying as Hispanic and any race are counted for both the Hispanic ethnicity and for the race with which they identified.
Race/Ethnicity
| Race/Ethnicity | Number of Operations | Percent of Operations | Number of Producers | Percent of Producers |
|---|---|---|---|---|
| American Indian/Alaska Native | 77 | 0.2% | 96 | 0.1% |
| Asian | 120 | 0.2% | 161 | 0.2% |
| Black or African American | 81 | 0.2% | 92 | 0.1% |
| Hispanic | 620 | 1.3% | 741 | 0.8% |
| Multi-Race | 265 | 0.5% | 325 | 0.4% |
| Native Hawaiian or Pacific Islander | 28 | 0.1% | 30 | 0.0% |
| White | 48,856 | 99.6% | 89,328 | 99.2% |
The overwhelming majority of producers in Pennsylvania are white (99.2%); accordingly, the vast majority of operations in Pennsylvania (99.6%) also have at least one white producer. However, it is important to note that some of these producers are likely to identify as both Hispanic and white, though it is not possible to know exactly how many due to the Census of Agriculture’s reporting standards around race and ethnicity.
The next largest demographic group of producers is Hispanic, but this group is several orders of magnitude smaller at just 741 individuals (0.82% of producers) working for 620 operations (1.26% of farms). No other group has over 500 individuals or has producers at 1% or more of farms.
Sex
| Sex | Number of Operations | Percent of Operations | Number of Producers | Percent of Producers |
|---|---|---|---|---|
| Male | 46,713 | 95.2% | 49,053 | 65.4% |
| Female | 27,784 | 56.6% | 31,135 | 34.6% |
A solid majority of producers in Pennsylvania are male (65%), and an overwhelming majority of farms have at least one male producer (95%). About a third of producers are female (34.6%), and more than half (56.6%) of operations have at least one female producer on site.
Military Status
| Military History | Number of Operations | Percent of Operations | Number of Producers | Percent of Producers |
|---|---|---|---|---|
| Active-Duty Military or Veteran | 5,698 | 11.6% | 6,058 | 6.7% |
| Never Served or Only on Active Duty in Reserve or National Guard | n/a | n/a | 83,974 | 93.27% |
About 11% of operations have at least one active-duty military or veteran producer. Data is not available for the number of farms that totally lack active-duty military producers.