On May 15, 2024, Feeding America released updated Map the Meal Gap food insecurity estimates for the United States using 2022 data. In this policy blog, CPFB Policy Research takes a first look at the data for central Pennsylvania ahead of a more comprehensive report anticipated to be released this summer.
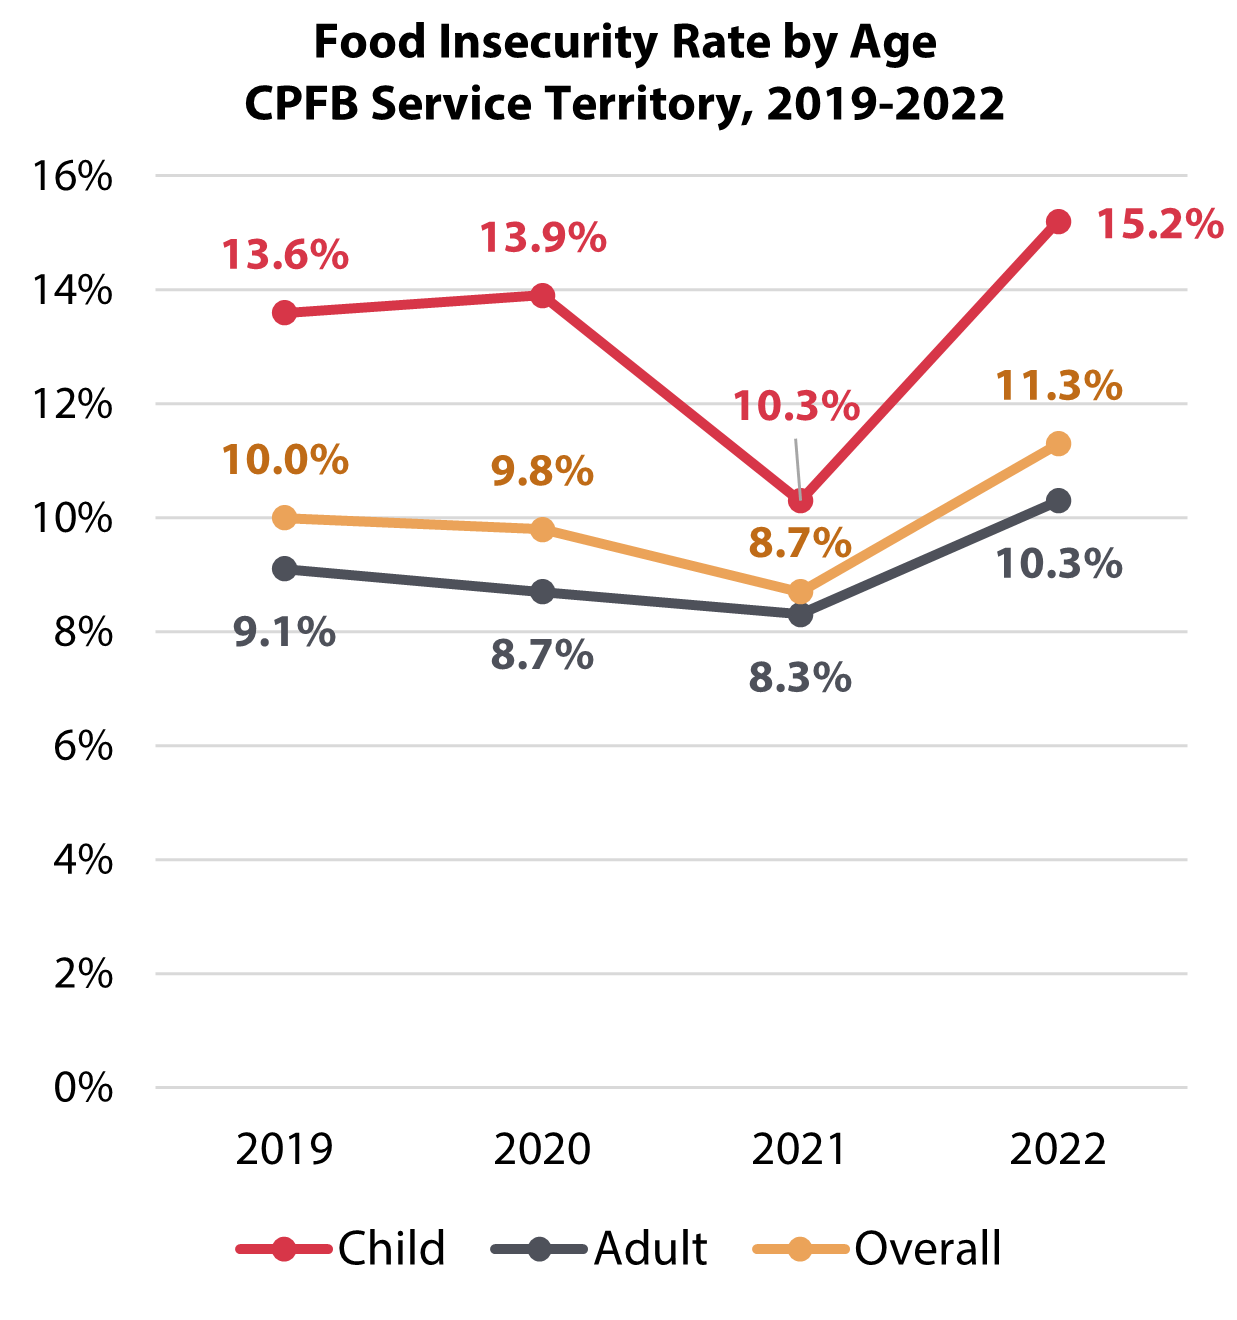
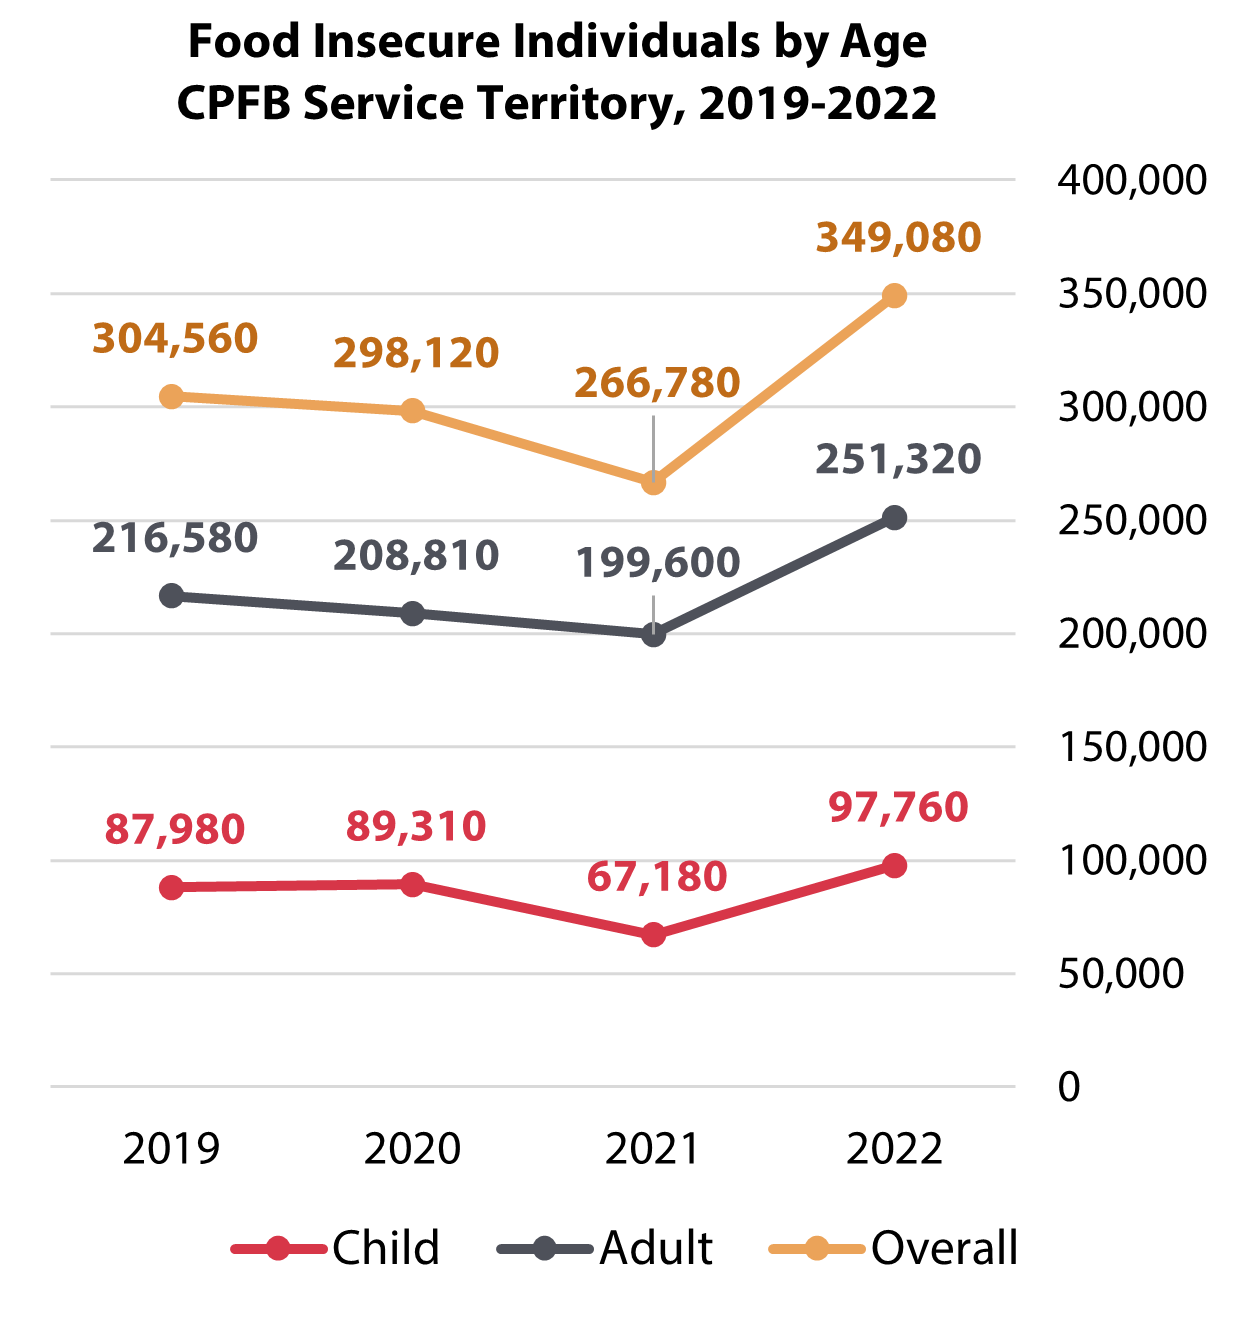
The overall food insecurity rate increased 30% from 2021 to 2022 in the Central Pennsylvania Food Bank’s service territory, spiking nearly three percentage points from 8.7% to 11.3%, according to Feeding America’s Map the Meal Gap estimates. As a result of this jump, 80,000 more central Pennsylvanians were food insecure in 2022 than in 2021. More than 30,000 of these individuals were children, as 2022’s increase in food insecurity was especially pronounced among youth. Child food insecurity rates rose 45% in just one year, from 10.3% to 15.2%.


Although Map the Meal Gap estimates have a significant data lag, they generally align with the local trends the CPFB team was tracking in real time in 2022 via partner statistical reporting and other sources such as Service Insights on MealConnect and neighbor surveys. CPFB and its partner agencies and programs rendered more than 125,000 more household-level services to neighbors in need in 2022 than in 2021, which was a nearly 18% year-over-year increase.
2022’s jump in food insecurity rates and the uneven impact seen across age groups is due, at least in part, to the expiration of several key pandemic-era programs that provided critical support to low-income individuals and families, such as the expanded Child Tax Credit (CTC).
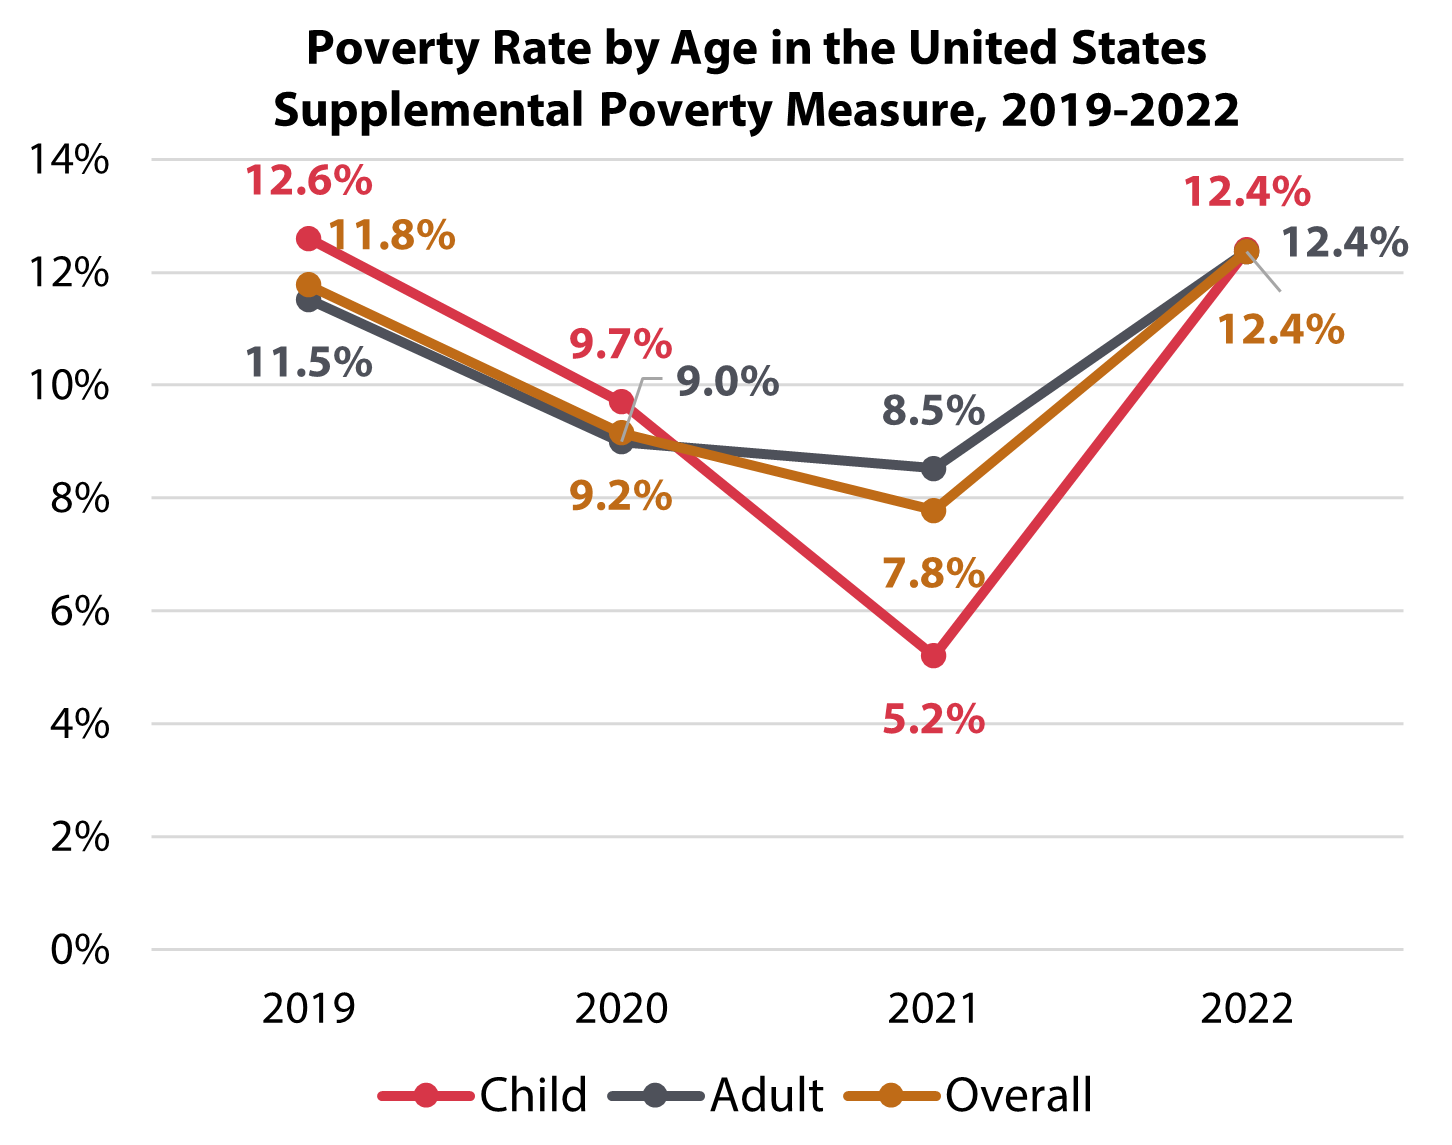
The expanded CTC provided up to $300 per month to low-income children, and it had a dramatic impact on child poverty. A 2022 Census Bureau analysis using the Supplemental Poverty Measure, which accounts for the impact of government programs, found that the program had cut the child poverty rate almost in half, from 9.2% to 5.7%, and lifted 2.9 million children out of poverty nationwide between 2020 and 2021. Another Census Bureau report released in 2023 showed that rates had more than doubled in 2022 following the expanded CTC’s expiration, rising to 12.4%, a rate comparable to pre-pandemic levels.

Poverty is the primary driver of food insecurity; therefore, it should be expected that food insecurity rates correspond with poverty rates and that the biggest change would be seen among children, who were the primary beneficiaries of the expanded CTC. Indeed, as discussed above, that is exactly what happened.
However, the end of the expanded CTC does not explain the entirety of 2022’s increase in food insecurity. Adult food insecurity also grew, though not as sharply as among children, and the overall 2022 food insecurity rate still exceeds pre-pandemic levels by about 10%. Similarly, adult and all-age poverty rates increased back to rates comparable to or in excess of those seen in 2019. For these reasons, it is probable that there are other contributing factors to 2022’s increased food insecurity rate beyond pandemic programs’ expiration, causing a rebound to pre-pandemic conditions among children.
The most likely other factor is inflation: an independent grocery price index produced by Datasembly, a retail data aggregation and analysis firm, indicates that Pennsylvania specifically saw an overall average grocery price increase of 4.8% in calendar year 2022. Additionally, the federal Bureau of Labor Statistics calculated that the cost of food at home has increased by a staggering 27% in the last five years nationwide. Grocery price increases affect everyone, but they strain low-income individuals who are already stretching their budgets, so it would make sense that inflation would impact food insecurity rates.
This blog post is just a high-level view of food insecurity’s scope and scale in central Pennsylvania. Later this year, CPFB Policy Research will release a longer analysis of the 2022 Map the Meal Gap estimates for our service territory that will include more focus on disparities within our community by race, place, and age.
Additionally, we are always working to understand more about the root causes and lived experience of food insecurity throughout our service territory; for more reading about upstream and intersecting issues of food insecurity in a few of central Pennsylvania’s communities, please see our Lancaster County and Lebanon County Community Hunger Mapping Reports, and stay tuned for the launch of our Snyder, Union, and Northumberland (SUN) Community Hunger Mapping Report in July!
