by Morgan Flood, Policy Research Specialist
The following report assesses 2022 food insecurity rates in the 27 counties served by the Central Pennsylvania Food Bank (CPFB) and how these rates have changed since 2021 using recently released Feeding America Map the Meal Gap food insecurity estimates.
The data in this report are best considered as lagging indicators, as they describe food insecurity in the CPFB’s service territory in 2022; the conclusions written below are therefore not directly reflective of the current food insecurity situation as of August 2024, though they are still informative. In fact, available proxy metrics, such as partner agency-reported service statistics and order volume, indicate that food insecurity rates in the present are very likely to be as high or higher than Map the Meal Gap reflects. Between 2022 and 2023, CPFB partners reported a 27% increase in the number of households they served; 2024 is on pace to exceed 2023 as well.
Because of the expiration of key government investments, such as the expanded Child Tax Credit (CTC) that brought food insecurity rates down in 2021, rates rebounded dramatically in 2022 and rose higher than any other point in the last five years. The jump in food insecurity was especially pronounced among children, who were the primary beneficiaries of the expanded CTC.
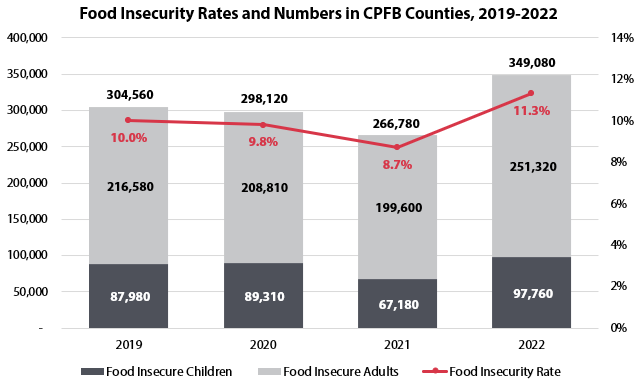
Figure 1. Food insecurity rates and the number of food insecure children/persons between 2019 and 2022 for counties served by the Central PA Food Bank according to Feeding America’s Map the Meal Gap estimates.
The fall in food insecurity and poverty between 2020 and 2021 and its subsequent rise in 2022 together clearly demonstrate the ability of the United States to lower food insecurity through strong governmental policy and programmatic responses, if there is the political will to implement them. Public policy is a critical tool in the effort to meet the Feeding America goal of a 5% national food insecurity rate by 2030.
Food insecurity rates across the CPFB’s service territory rose almost 30% in just one year, spiking from 8.7% in 2021 to 11.3% in 2022. The number of food insecure people correspondingly jumped by 82,300 in 2022, from 266,780, to 349,080.
The below maps show the all-age food insecurity rate by county in 2021 and 2022.
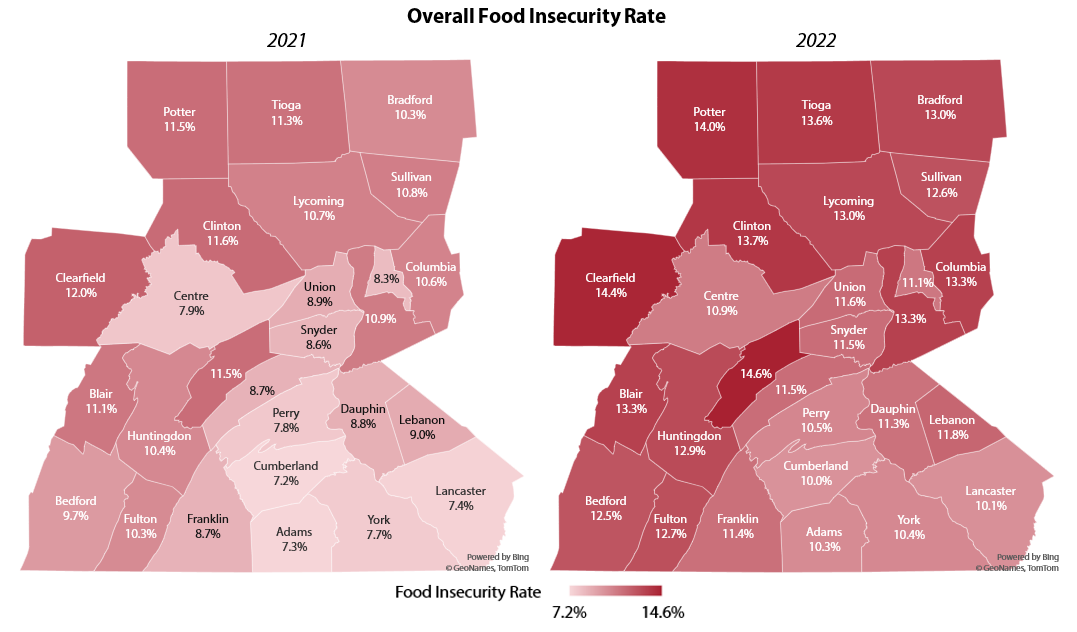
- Every CPFB county saw an increase in food insecurity, with five seeing increases greater than 35%; these counties were Adams (41.1%), Cumberland (38.9%), Centre (38.0%), Lancaster (36.5%), and York (35.1%).
- The increase in food insecurity rates in CPFB counties was driven by a rise in child food insecurity that itself is primarily the result of the expiration of the 2021 expanded CTC, which will be discussed in more detail later in this report.
- Inflation may also play a role, especially since 2022’s all-age food insecurity rates are also higher than 2019 and 2020.
- A price index produced by Datasembly, an independent retail data and aggregation firm, shows that Pennsylvania saw an average grocery price increase of 4.8% in 2022 alone, and the federal Bureau of Labor Statistics calculated that the cost of food of home has shot up by 27% in the last five years nationally.
- Rural counties in the northern and western parts of the CPFB’s service territory continue to have the highest proportions of food insecure individuals in the region with rates mostly north of 12%, while the southeast corner has lower rates that lie between 10% and 12%.
The number of food insecure individuals increased across every county in the CPFB’s service territory between 2021 and 2022. Of the 349,080 food insecure individuals in 2022, 82,300 individuals are newly food insecure. More than a third of newly food insecure individuals are children (30,580).
The below maps show the number of food insecure individuals by county in 2021 and 2022.
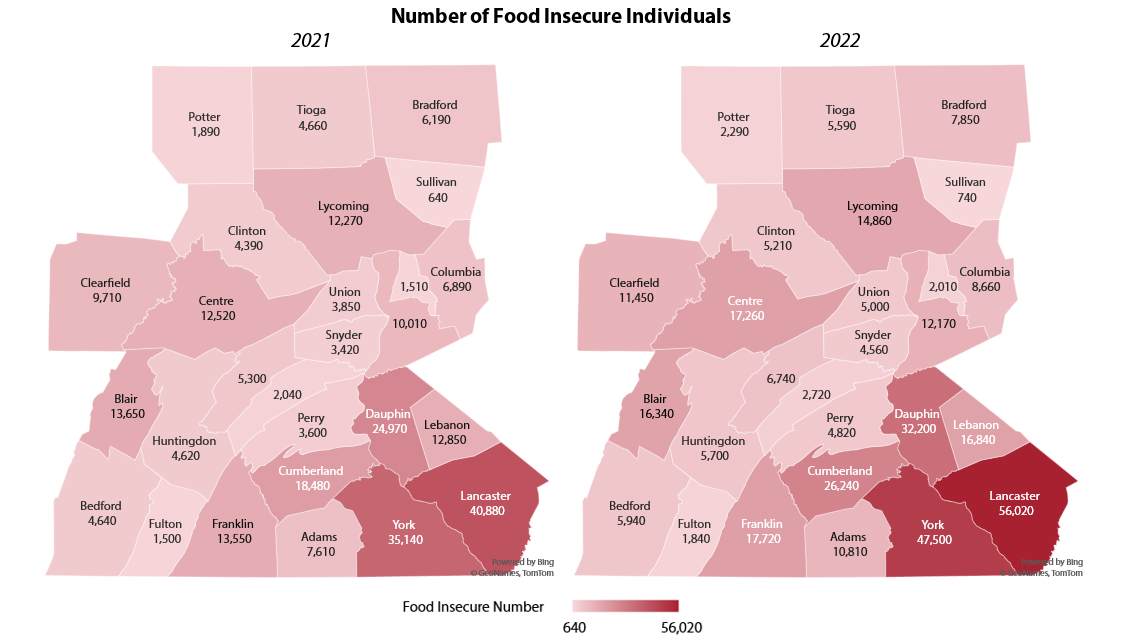
- Though the southeastern counties of CPFB’s service territory generally have lower food insecurity rates than the rural north and west, they are more populous and are therefore home to the highest numbers of food insecure individuals.
- Every CPFB county saw an increase in the number of food insecure individuals, with the most populous counties seeing the largest increases. Lancaster County leads with an increase of 15,140 people, followed by York with 12,360, Cumberland with 7,760, and Dauphin with 7,230. No other county saw an increase of more than five thousand individuals, though Centre nears it at 4,740.
- More than half (57.3%) of newly food insecure individuals across the CFPB’s service territory live in these five counties, and nearly a fifth (18.4%) live in Lancaster County alone. York County makes up another 15% of the newly food insecure population, followed by Cumberland at 9.4%, Dauphin at 8.8%, and Centre at 5.8%.
- Lancaster, York, Cumberland, and Dauphin counties together made up just over half of the overall population of the CPFB’s service territory as of 2022 at 50.6%; these counties also account for 46.4% of the total food insecure population.
- Including Centre County, the top five counties in CPFB’s service territory comprise 55.8% of total population and 51.3% of the food insecure population.
- Including Centre County, the top five counties in CPFB’s service territory comprise 55.8% of total population and 51.3% of the food insecure population.
Child food insecurity spiked even faster than the overall rate between 2021 and 2022; it increased 45% across the CPFB counties in that time frame, jumping from 10.3% to 15.2%. More than 30,000 central Pennsylvanian children were newly food insecure in 2022. As mentioned above, this increase is attributable to the expiration of key government supports like the expanded CTC, which drove a significant drop in child poverty and food insecurity while they were in effect.
The below maps show 2021 and 2022 child food insecurity rates at the county level.
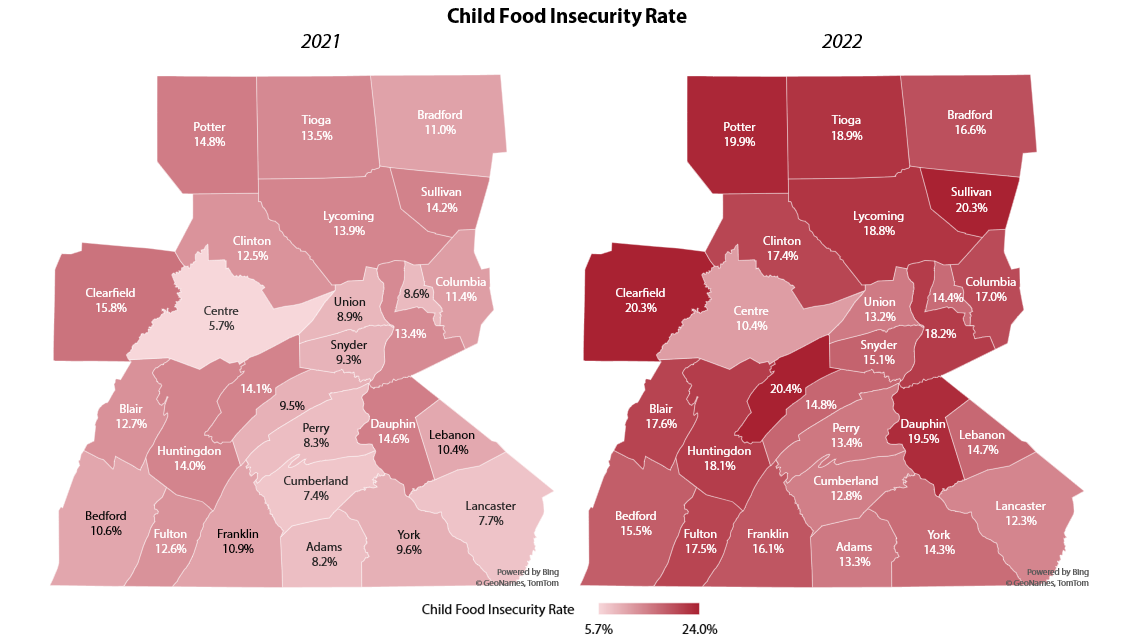
- All 27 CPFB counties had major increases in child food insecurity in 2022. Nine counties had increases of more than 50%, led by Centre County with a staggering 82.5% jump from 5.7% to 10.4%, which is still the lowest overall rate of any CPFB county. Penn State University’s main campus in State College is a large and unusual demographic factor that contributes to Centre County’s outlier status on this front.
- The other eight counties with increases of more than 50% were Cumberland (73.0%), Montour (67.4%), Snyder (67.4%), Adams (62.2%), Perry (61.4%), Lancaster (59.7%), Juniata (55.8%), and Bradford (50.9%).
- Mifflin (20.4%), Sullivan (20.3%), and Clearfield (20.3%) counties all had child food insecurity rates above 20%. Two more counties, Potter (19.9%) and Dauphin (19.5%), were just under 20%.
- As with overall food insecurity, it is important to keep in mind that while food insecurity rates are highest in the north and west of CPFB’s service territory, the absolute numbers of food insecure children are highest in the more populous southeast corner of the service area.
- Lancaster, York, Dauphin, and Cumberland counties are together home to 53.5% of the service territory’s children as well as to 50.1% of the food insecure children in the region.
- The main cause of the dramatic increase in child food insecurity was the end of the expanded CTC, which provided up to $300 per month to low-income children during 2021 and had a major impact on child poverty, which is the primary driver of child food insecurity.
- A 2022 Census Bureau analysis using the Supplemental Poverty Measure (SPM), a metric that accounts for the impact of government programs on poverty, found that the expanded CTC had nearly halved child poverty between 2020 and 2021, cutting it from 9.2% to 5.2%. A different Census Bureau report in 2023 after the end of the program then showed that child poverty had returned to a level comparable to those seen in 2019.
As of 2022, food insecurity rates among Hispanic and Black individuals were about three times those of white, non-Hispanic individuals in the CPFB’s service territory; one in four Black (27%) or Hispanic (24%) individuals were food insecure compared to only one in eleven non-Hispanic white (9%) individuals.
This dramatic disparity in food insecurity by race and ethnicity is the result of inequities in the underlying drivers of food insecurity, such as household income, employment, homeownership and disability status, which themselves are largely the direct result of historic, systemic racism and the policies that perpetuate it, including housing and employment discrimination and inequitable access to educational opportunities.
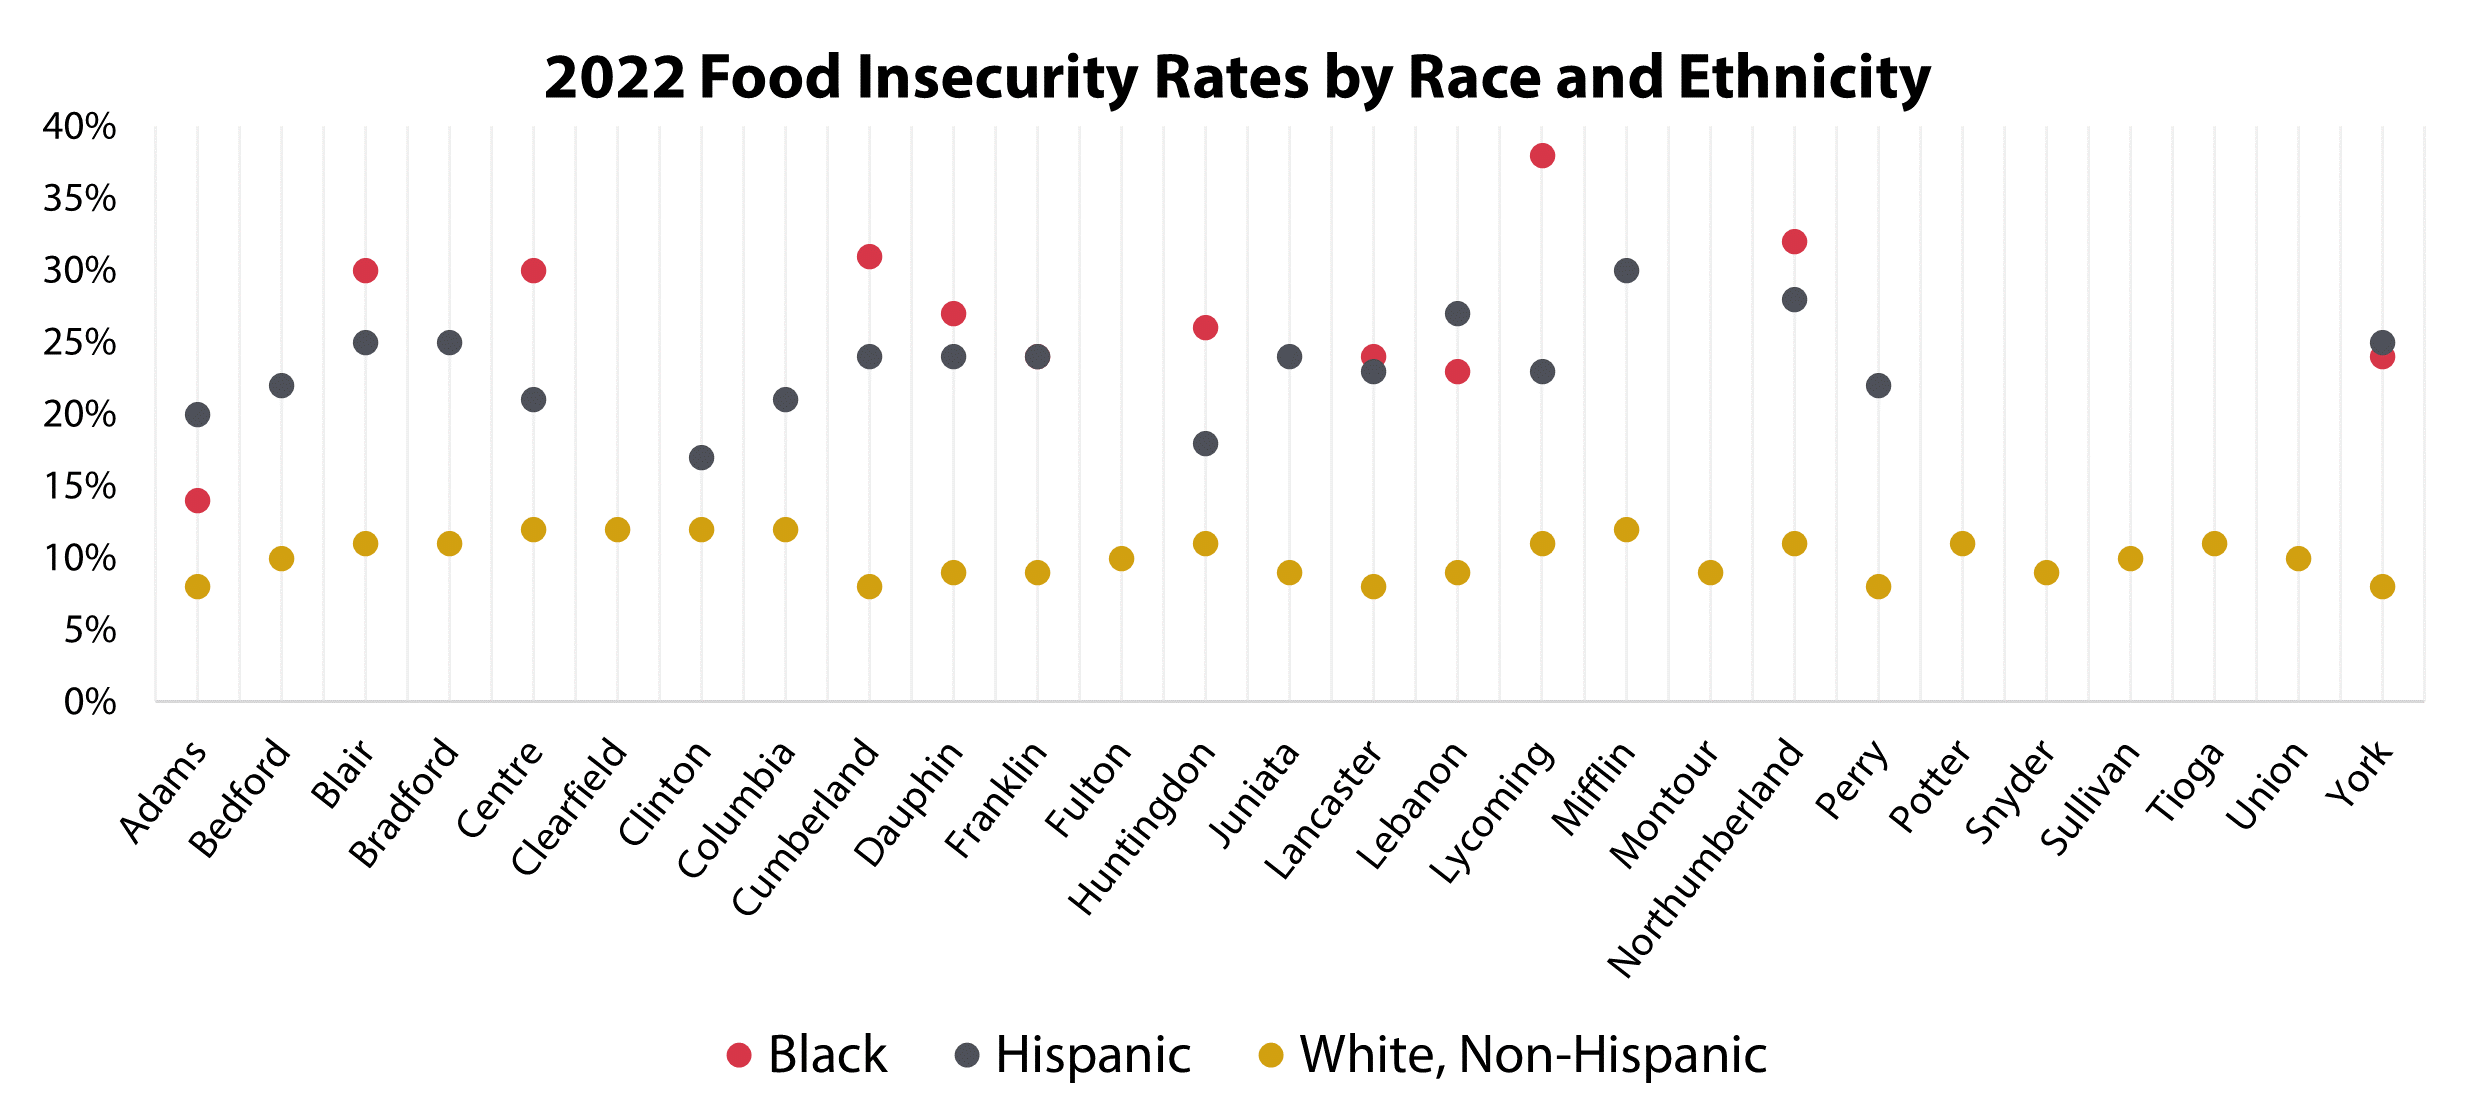
The chart displays the food insecurity rates among Black, Hispanic, and White, non-Hispanic individuals in Central Pennsylvania Food Bank Counties that have data available. Data used in this chart is from the 2024 Feeding America Map the Meal Gap model.
Only 12 of the 27 CPFB counties had sufficient data to estimate 2022 food insecurity rates for Black individuals. Of these, Adams County had the lowest, at 14%, while Lycoming had the highest at 38%. Four other counties had rates at or above 30%: Northumberland (32%), Cumberland (31%), Blair (30%), and Centre (30%).
There were 19 counties for which Hispanic food insecurity rates could be calculated. Clinton County had the lowest rate among Hispanic individuals at 17%. Mifflin had the highest, at 30%. Five more counties came in at or above 25%: Northumberland (28%), Lebanon (27%), Blair (25%), Bradford (25%), and York (25%).
Methods and Data: This report is an analysis of the change in the food insecurity situation between calendar year 2021 and 2022 using the 2024 Feeding America Map the Meal Gap model, which estimates food insecurity based on its relationship to multiple demographic and socioeconomic factors such as poverty, unemployment, median income, homeownership rates, and disability status.
